- Pin
- ⏰ Just a Few Days Left!
🔥 The 12th Anniversary Celebration is Ending Soon — Don’t Miss Your Chance to Claim Rewards
🚀 Limited-Time Revelry #5 is Live
👉 Log in & play to win iPhone 16 Pro, MacBook Air and more: https://www.gate.com/activities/12th-anniversary
🏆 Draw for merch & send greetings on the Greeting Wall to win exclusive merch prizes
More Details: https://www.gate.com/announcements/article/44624
#Gate12Years#
- 🔥 Gate Post Ambassador Exclusive Posting Reward Task Round 2 Is On! 🏆 Round 1 winners will be announced on May 26!
Sign up now 👉 https://www.gate.com/questionnaire/6722
Registration Period 🕙 May 23, 03:00 AM – May 26, 04:00 PM UTC
✍️ Post daily from May 26 to June 1 and share a $300 prize pool based on your post quality!
🎁 Reward Details:
S-Level Weekly Ranking Reward
Post every day for 7 days with an overall quality score above 90 to qualify for S-Level.
2 outstanding ambassadors will each receive a $50 trading fee rebate voucher.
A/B-Level Tiered Rewards
Based on the number of posts and
- 🎉 #Gate Post# Hits 50,000 Followers!
✨ To celebrate this amazing milestone, we're giving back to our incredible community!
🎁 4 Lucky Winners Will Each Receive $10 Points!
Join:
1️⃣ Follow Gate_Post
2️⃣ Like this post
3️⃣ Drop your congratulations in the comments!
End at 18:00, May 25 (UTC)
- 🔥 Gate Post Ambassador Exclusive Posting Reward Task Is On!
👉 Post daily from May 19 to May 25 and share a $300 prize pool based on your post quality!
Join now: https://www.gate.io/questionnaire/6679
Registration deadline: May 20 10:00 UTC
🎁 Reward Details:
S-Level Weekly Ranking Reward
Post every day for 7 days with an overall quality score above 90 to qualify for S-Level.
2 outstanding ambassadors will each receive a $50 trading fee rebate voucher.
A/B-Level Tiered Rewards
Based on the number of posts and their quality, ambassadors will be ranked and rewarded accordingly:
A-Level:
Post on
Web3 on-chain data interpretation: Active Solana trading in April, Ethereum capital inflow.
Summary
• In April, Solana maintained an average of over 93 million transactions per day, with a cumulative total of 2.8 billion transactions as of April 30, continuing to lead across all chains.
As of April 28, in the funding flow data of various public chains for April, Ethereum recorded a net inflow of over 904 million USD, ranking first across the entire network.
• Wallet addresses holding more than 10,000 BTC have a cumulative score between 0.9 and 1, indicating they are almost in a state of full net buying.
• The net growth value of BTC UTXO continues to turn positive, indicating a rebound in momentum, with new addresses maintaining an average of 300,000 per day, and the rebound is mainly driven by existing users.
As of April 28, the LaunchLab platform has created a total of 25,207 tokens, with a graduation rate of approximately 0.84%.
•$TRUMP leveraged a golf dinner and White House tour event to ignite market enthusiasm, with prices soaring over 50%, while on-chain holdings and activity levels increased simultaneously.
On-chain Data Summary
Overall Situation on the Chain
On-chain daily trading volume
In April, Solana maintained an average of over 93 million transactions per day, with a cumulative total of 2.8 billion transactions as of April 30, continuing to lead the entire chain. Base and Sui stabilized in the range of 7 million and 6.1 million transactions, showing strong activity. Polygon PoS and Ethereum recorded daily transaction volumes of over 2.9 million and 1 million, respectively, with relatively stable trends. TON and Bitcoin had lower transaction volumes, generally maintaining between 200,000 and 400,000 transactions.
Overall, Solana remains in the top position, while the emerging chains Base and Sui, though still small in overall scale, have frequent interactions and strong ecological momentum. Base benefits from the backing of the Coinbase ecosystem and the active promotion of meme coins, achieving a stable average daily trading volume of over 7 million transactions, and at one point in mid-April recorded an average daily Gas revenue of nearly $350,000, showcasing its commercialization potential. Sui, on the other hand, leverages the development advantages of the Move language and use cases such as gaming and NFTs, with an average daily trading volume reaching 6.1 million transactions, maintaining high-frequency interactions. Both rapidly expand in a low-fee, high-interactivity blockchain environment, representing the most promising emerging public chains at present.
Daily Gas Fees for Each Chain
In April, Solana's gas revenue continued to lead, with an average daily fee exceeding $1.2 million, totaling $37.5 million by April 30. Bitcoin and Ethereum followed closely, with average daily revenues roughly between $500,000 to $700,000. Base briefly surged to nearly $350,000 in the middle of the month, showing impressive performance. The average daily fees for Sui, Polygon PoS, and TON remained below $50,000, maintaining a low level. Overall, the leading chains continue to excel in fee revenue, while emerging chains like Base have gradually shown commercial potential.
The User Base and Ecological Dynamics Behind Solana's High-Frequency Interactions
In April, Solana not only maintained an average of 93 million transactions per day, but its daily active addresses also remained above 4 million, with a monthly average of about 4.5 million, indicating that trading activity is not solely driven by bots or a single protocol, but is built on a broad user base. Especially on April 11, active addresses exceeded 6.2 million at one point, further highlighting the concentrated explosion of ecological activity.
In addition, Solana's daily average Gas revenue exceeds 1.2 million USD, far higher than most public chains, indicating that on-chain transactions are not only frequent but also supported by real transaction fees, rather than being "zero-cost volume inflation." This trend is closely related to MEV reward mechanisms like Jito, with a large number of high-frequency traders and arbitrage bots active on the chain, driving up fees. Moreover, platforms for issuing Meme coins like Pump.fun continue to attract creators, alongside the Swap transaction volumes supported by aggregation trading platforms like Jupiter, which helps maintain high levels of on-chain interaction over the long term. 【3】
Public Chain Bridge Net Flow
In the funding flow data of various public chains for April, as of April 28, Ethereum recorded a net inflow of over 904 million USD, ranking first across the network. This reversed the trend of continuous outflows in the previous three months and reestablished its core position as a "value reservoir." This reversal trend may be related to the recovery of market risk appetite, stabilization of on-chain activities on L2, and rising expectations for ETFs, attracting long-term capital back to the main chain.
Among emerging public chains, Sonic has shown outstanding performance, attracting over $124 million in net inflow in a single month, ranking second on the list. This reflects its high-performance architecture and low-cost transactions, which have attracted new capital attention, and the market recognizes its ecological growth potential. Meanwhile, Base and Arbitrum recorded net inflows of approximately $64.8 million and $62.1 million respectively, indicating that some L2 networks still maintain a net inflow of funds, benefiting from a stable developer base and user growth. Smaller ecological chains like Sui and Hyperliquid maintained slight net inflows, reflecting their ability to attract funds in vertical scenarios such as trading and gaming.
In comparison, Berachain experienced a net outflow of up to $704 million, the highest among all chains. The OP Mainnet and Polygon PoS also saw outflows of $400 million and $57 million, respectively, indicating that some funds have been temporarily reallocated to other public chains or off-chain markets. Overall, there was a structural recovery in capital flows in April, with Ethereum making a strong comeback and Sonic emerging as an unexpected contender, while some early hot projects faced pressure from capital redistribution. The competitive landscape of public chains is quietly changing.
Bitcoin Key Indicator Analysis
The following will filter and analyze several key indicators of Bitcoin and summarize market trends based on this.
Bitcoin Different Position Size Buying Trend: Large Funds Continue to Net Buy, Rebound Signal is Clear
According to Glassnode data, during the recent recovery of Bitcoin prices, large holders have clearly shown a consistent buying behavior.
•Wallet addresses holding more than 10,000 BTC have a cumulative score between 0.9 and 1, indicating they are almost in a state of full net buying.
•Addresses holding 1,000 to 10,000 BTC with a cumulative score between 0.7 and 0.8 indicate that this group is actively increasing their holdings.
•Medium holders of BTC holding between 10 to 1,000 coins have seen their accumulated score rise back to around 0.5, indicating a shift from neutral to a buying inclination.
This means that during the rebound process after the Bitcoin price correction in mid-April, large funds (whales) have taken the lead in entering the market and continue to absorb chips, gradually boosting market confidence. Such funds have always had a significant impact on price trends, and their concentrated positioning behavior is usually seen as an important signal for medium to long-term upward movements.
UTXO net growth turned positive, Bitcoin on-chain activity rebounded
UTXO (Unspent Transaction Output) is the most basic accounting unit in Bitcoin, which can be seen as "change" that has not yet been used, controlled by the private key of the corresponding address, until it is used in the next transaction. Its mechanism ensures the transparency and traceability of the blockchain, and is at the core of Bitcoin's decentralized structure. Changes in the total number of UTXOs reflect on-chain activity; an increase usually indicates a rise in transaction frequency, an increase in new addresses, or fund distribution, representing network activity; a decrease may indicate transaction consolidation, a reduction in users, or market observation, reflecting a slowdown in network usage.
According to on-chain data from Glassnode, since April 11, the net growth of UTXO has continued to turn positive, with a significant increase in the green bar portion, indicating that network activity is gradually recovering and on-chain trading behavior is becoming more frequent. Meanwhile, the total UTXO amount has also begun to rise, echoing the upward trend in Bitcoin prices, suggesting that the market may be experiencing a new growth cycle or is in the early stages of recovery. This indicator provides important references for on-chain capital flow and user participation, and is often seen as a leading signal for assessing market heat and on-chain health.
It is worth noting that although UTXO turned to positive growth in April, reflecting an increase in on-chain transaction activity, the number of new addresses has not seen significant growth. According to Glassnode data, the number of new addresses during April roughly maintained in the range of 300,000 to 350,000 per day, lacking a noticeable breakthrough, indicating that this round of on-chain recovery is more attributed to the return of existing users and an increase in trading frequency, rather than the entry of new investors.
This structural feature indicates that the current market is still in the repair phase dominated by existing users, with new users yet to form a trend of expansion. Although on-chain metrics are overall improving, to support a longer-term price increase, it is still necessary to continuously monitor whether new addresses increase in tandem with rising prices, in order to verify whether the market has entered a new phase of "incremental capital-driven" growth. [8]
The proportion of profitable Bitcoin addresses rises to 93%, market sentiment warms up
While existing users are returning and increasing interaction frequency, market sentiment is gradually warming up as prices rise, which can be further observed from the changes in the proportion of profitable addresses. According to Glassnode data, during the recent rebound in Bitcoin prices, the proportion of addresses holding coins in profit on-chain has also risen. This indicator (Percent of Addresses in Profit) represents the proportion of addresses where the current coin price is higher than the average purchase price of the address, and can be used to measure the overall "holding profit state" of the market.
From the chart, since mid-April, when the price of Bitcoin started to rise, this ratio has quickly rebounded and currently stands at 93%. This indicates that the majority of investors have returned to a profitable state, and the pressure from earlier adjustments causing unrealized losses is rapidly easing. This trend usually signals a shift in market sentiment from pessimism to neutrality or even bullishness, which not only helps to stimulate new buying momentum but may also be accompanied by some profit-taking. If prices continue to operate at high levels and drive further increases in the proportion of profitable addresses, the market may enter the early stages of a new upward cycle.
Market Trend Summary
In April, the on-chain ecosystem showed differentiation, with Solana firmly holding the title of both trading volume and Gas revenue champion, demonstrating strong mainnet capabilities; Base and Sui showed increased activity, revealing potential. Although Ethereum leads in capital inflow, its on-chain activity remains relatively stable; Berachain and Polygon PoS face pressure from capital outflows. Overall, mainstream chains consolidate their leading positions, while competition among emerging chains intensifies.
From the perspective of comprehensive on-chain data, Bitcoin is currently in the early stages of a structural rebound. Large holders have entered the market first and continue to accumulate, becoming an important driving force behind this price rebound. The on-chain unspent transaction outputs (UTXO) have turned to positive growth since mid-April, and the frequency of transactions and network activity have increased simultaneously, indicating a recovery of on-chain momentum. However, it is important to note that Glassnode data shows that the number of new addresses during April did not increase significantly, maintaining an average of between 300,000 and 350,000 per day, which means that the current recovery is mainly driven by existing users, and has not yet welcomed a widespread influx of new funds.
At the same time, the proportion of profitable addresses has rapidly rebounded to 93%, reflecting that most investors in the market have returned to a profitable state, panic sentiment has significantly eased, and the overall sentiment is gradually turning to neutral and bullish. If prices and on-chain activity indicators continue to strengthen, driving synchronized growth in new users, the market is expected to welcome further influx of incremental funds and enter the next round of upward cycle.
Popular Projects and Token Trends
Overview of Popular Project Data
LaunchLab
The leading decentralized exchange in the Solana ecosystem, Raydium, officially launched its token issuance platform LaunchLab on April 16, providing creators and developers with low-threshold, uncensored on-chain token issuance and liquidity launch tools. Users can issue tokens using various pricing curves (linear, exponential, logarithmic) and quote assets (such as SOL), and integrate AMM V4 with the locking mechanism; creators can also continue to receive 10% of the AMM trading fees after the token "graduates".
Since its launch nearly two weeks ago, as of April 28, the LaunchLab platform has created a total of 25,207 tokens, of which only 211 (0.84%) successfully raised funds and migrated to the AMM liquidity pool, indicating a high success threshold. The peak of token creation occurred on April 27, with over 7,500 created in a single day; while the peak for graduated tokens was concentrated on April 25 and 26, with a total of over 110 graduated in those two days. Overall, although LaunchLab has lowered the threshold for token issuance, the success of a project still highly depends on the team's strength and market recognition.
Taking April 28 as an example, the two major token issuance platforms on the Solana chain present a stark contrast:
•Pump.fun created 29,612 tokens, of which 1,327 successfully graduated, with a graduation rate of 4.5%.
•Raydium's LaunchLab created 4,272 tokens, of which 104 successfully graduated, resulting in a graduation rate of 2.4%, which is significantly lower than Pump.fun.【12]
Overall, LaunchLab, as a new token issuance platform launched by Raydium, has quickly attracted a large number of creators and project parties in a short period of time, demonstrating strong ecological appeal and on-chain innovation vitality. Although the overall graduation rate is still in the early development stage, the platform has successfully lowered the issuance threshold, enriched the application and asset diversity on the Solana chain, and laid a solid foundation for the incubation and growth of more quality projects in the future. With the continuous improvement of market mechanisms and the gradual maturity of the community ecosystem, LaunchLab is expected to become an important force in driving financial innovation and enhancing user participation on the Solana chain.
Overview of Popular Token Data
$TRUMP—— The TRUMP token is a meme coin themed around political figures, deployed on high-performance blockchains such as Solana. It is favored by developers due to its low transaction costs and convenient issuance mechanism. This token is derived from the public image of the current U.S. President Donald Trump and is widely used in the PolitiFi (political finance) sector, successfully attracting market attention by combining community culture, hot events, and social media dissemination.
On-chain activity
The recent surge in the price of $TRUMP is primarily driven by market news. President Trump announced on April 24 that he would have dinner with the first 220 $TRUMP holders at a golf club near Washington in May, and he specifically invited the top 25 holders to a private reception and a White House tour. This news quickly spread on social media, igniting market sentiment and pushing the price of $TRUMP up by over 50% in a short period, making it one of the core hotspots in the recent Meme coin market.
This event has not only significantly increased the on-chain activity of $TRUMP, but also brought renewed attention to the potential of the PolitiFi sector. Investors have started to actively participate in the competition for holding rankings and are paying attention to whether there will be more similar incentive mechanisms in the future. On-chain data shows that since the announcement on April 24, the number of $TRUMP addresses holding over $1,000 has increased from about 18,000 to 21,900, a growth of over 21%; the total number of holding addresses has also risen from 640,000 to 643,000, further confirming that market enthusiasm has spread from the core community to a broader user base, showcasing the strong dissemination and attraction of political Meme coins driven by topics. 【15】【16】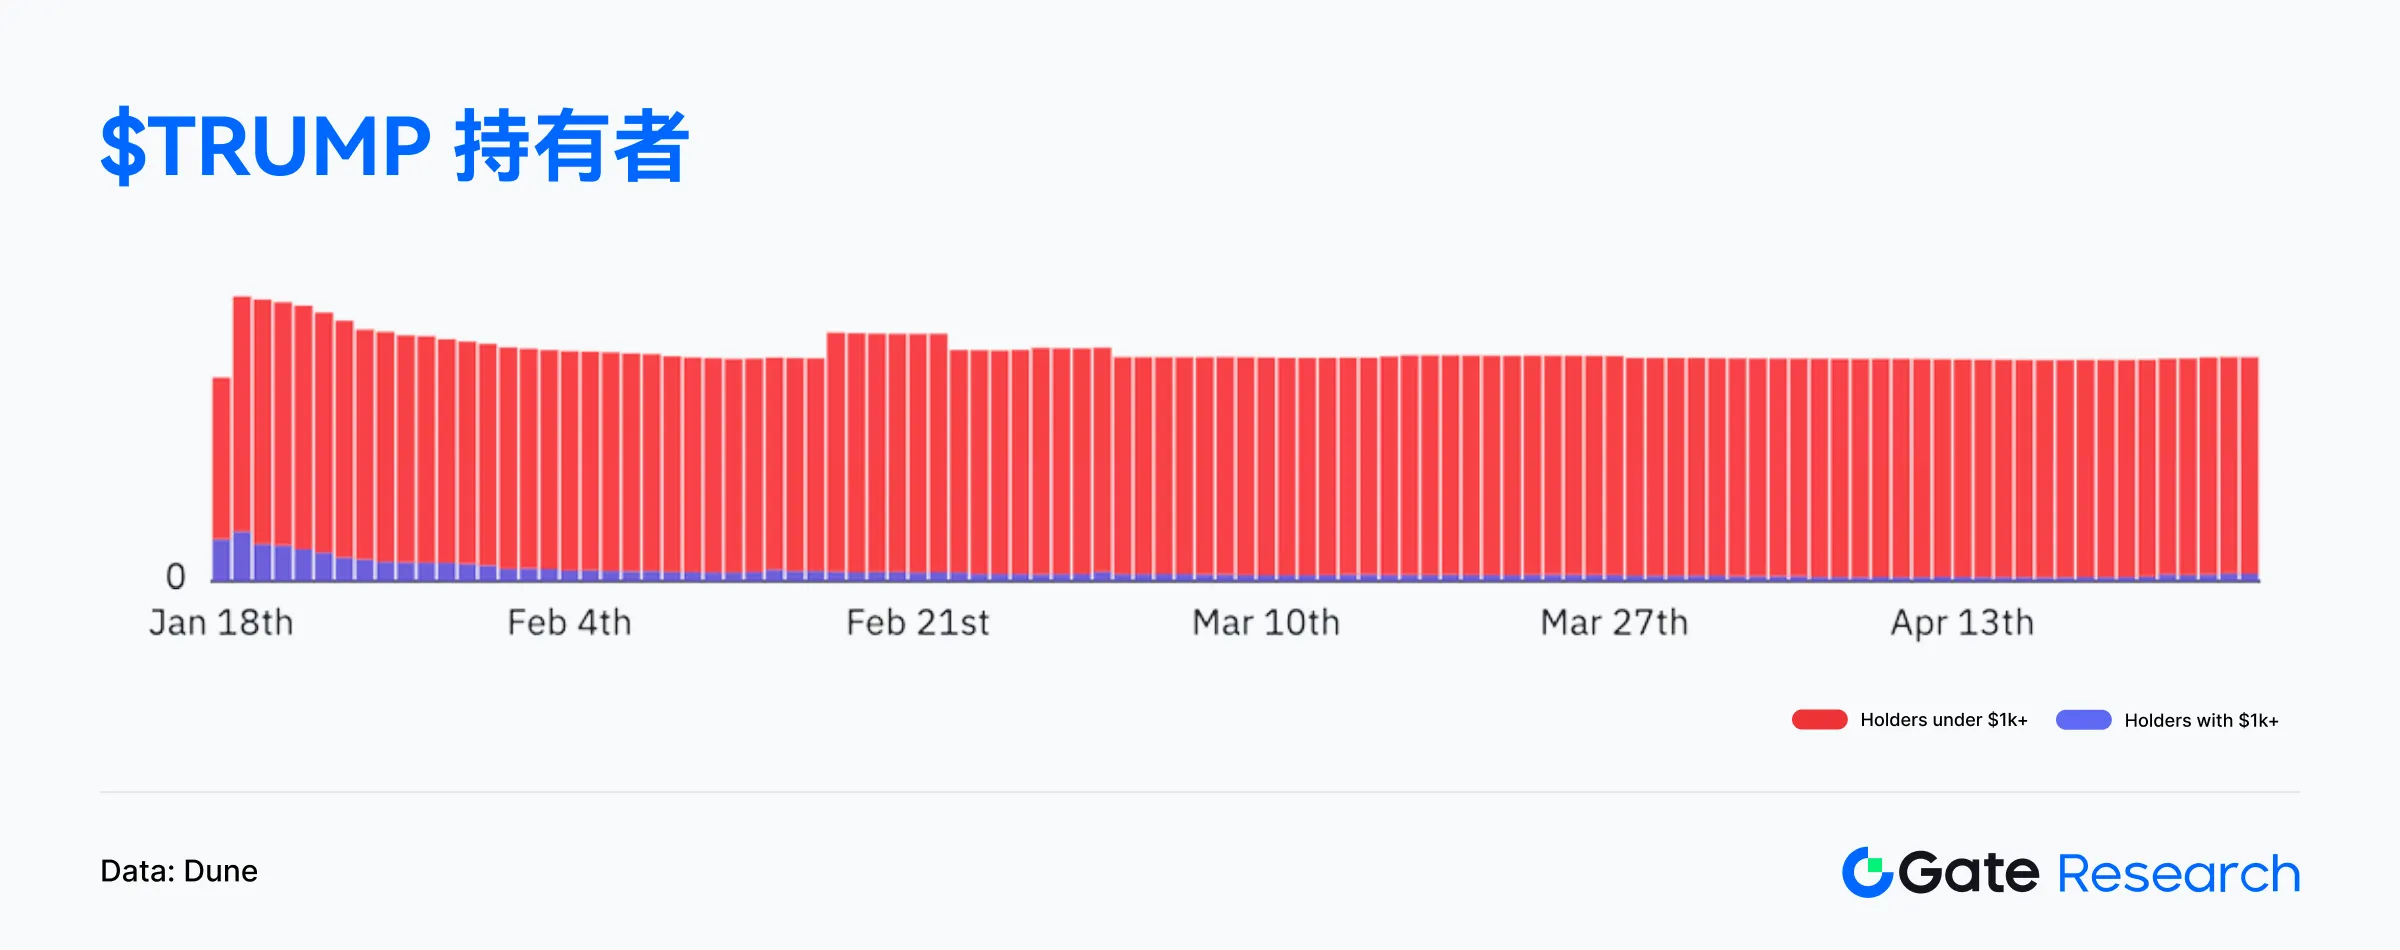
It is noteworthy that, according to Chainalysis data, since the launch of $TRUMP, its issuance team has accumulated over $320 million in revenue through transaction fees, reflecting the project's strong ability to attract capital beyond just speculation. On May 5, Trump also promoted the dinner scheduled for May 22, continuing to amplify market attention and discussion. This phenomenon highlights the diversification trend in the flow of funds within the crypto market, and reminds investors to maintain risk awareness when facing such highly volatile assets and to carefully assess their long-term value and sustainability. [17]
Summary
By April 2025, the on-chain ecosystem will show a clear differentiation. Solana, with an average daily transaction volume exceeding 93 million and over 4.5 million daily active addresses, continues to maintain its leading position among main chains, with average daily Gas revenue surpassing 1.2 million USD, indicating that its trading activity is built on a real user base and benefits from active ecological interactions and a surge in coin creation. The activity levels of Base and Sui are also rising in tandem, demonstrating the growth momentum of emerging chains.
The on-chain structure of Bitcoin continues to improve, with large addresses increasing their holdings, the UTXO turning positive, and the proportion of profitable addresses rising (reaching 93%), all of which support the restoration of market confidence. However, the number of new addresses remains between 300,000 and 350,000 daily on average, indicating that the current rebound is still primarily driven by existing users, and the influx of new capital has not yet fully started.
In terms of popular projects, LaunchLab in the Solana ecosystem quickly gathers creator resources and enriches the on-chain asset structure. With the help of offline topics and community incentives, the political meme coin $TRUMP has achieved a short-term price surge of more than 50%, and the number of on-chain token holders has expanded significantly. According to Chainalysis data, its issuance team has accumulated more than $320 million in fee income, highlighting its dual advantages in communication and gold absorption.
Overall, on-chain activity and capital flow are synchronously recovering, with ecological development gradually expanding from the underlying chain to the application layer. Coupled with the repair of market sentiment and the rise in risk appetite, it is worth continuously tracking the subsequent on-chain trends of mainstream assets and hot protocols.
Reference materials:
1.Artemis,
2.Artemis,
3.Artemis,
4.Artemis,
5.X,
6.Glassnode,
7.Glassnode,
8.Glassnode,
9.Glassnode,
10.X,
11.Dune,
12.Dune,
13.Dune,
14.Bloomberg,
15.Dune,
16.Dune,
17.Fortune,